 EpiData Software - Analysis
Examples of screen views
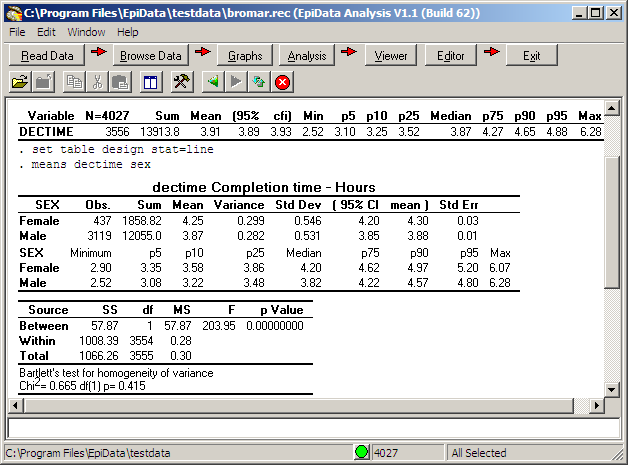
A toolbar guides the process from "Read Data" to "Exit" as shown in the figure below.
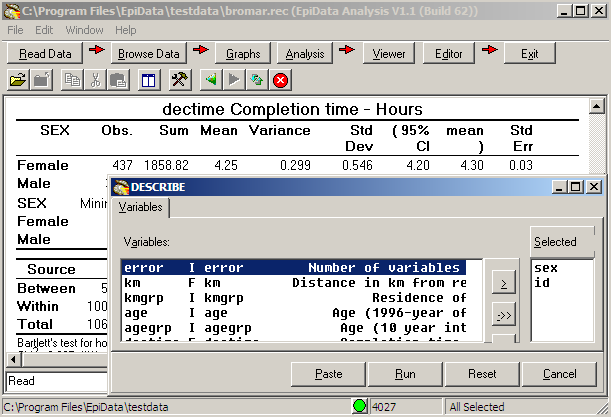
Dialog for selection of variables
Underlying each part of the toolbar is a sub menu, on which you can click for a given type of analysis. Following this a dialog will show up. You then choose the variables of interest and press run.
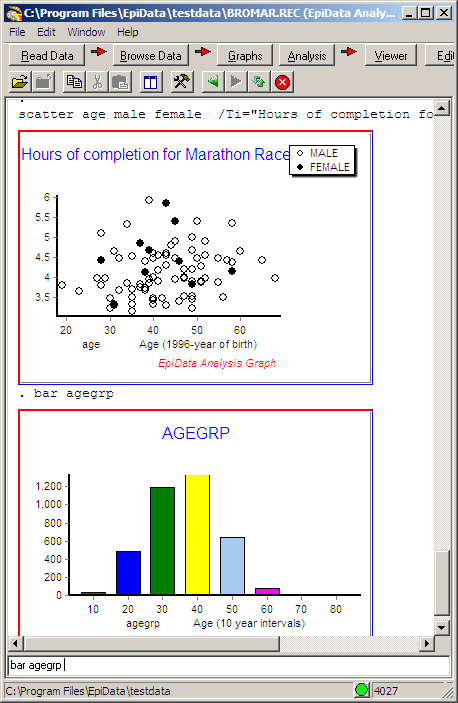
Examples of graphs
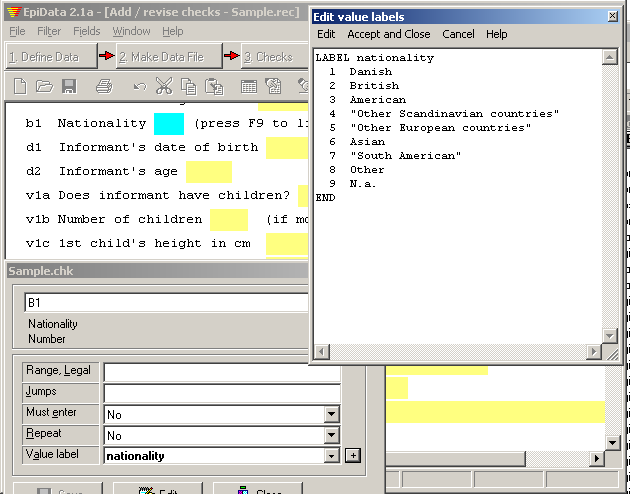
When you create tables, graphs or statistical output labels for categorial variables will be used. These are defined during data entry as seen here
Read the introduction to analysis. You will find this file on the download page